empty
 
 
04.10.2021 08:48 PM
How to trade EUR/USD on October 5? Simple advices for newbies

Let us take a look at the pair's movement on Monday:

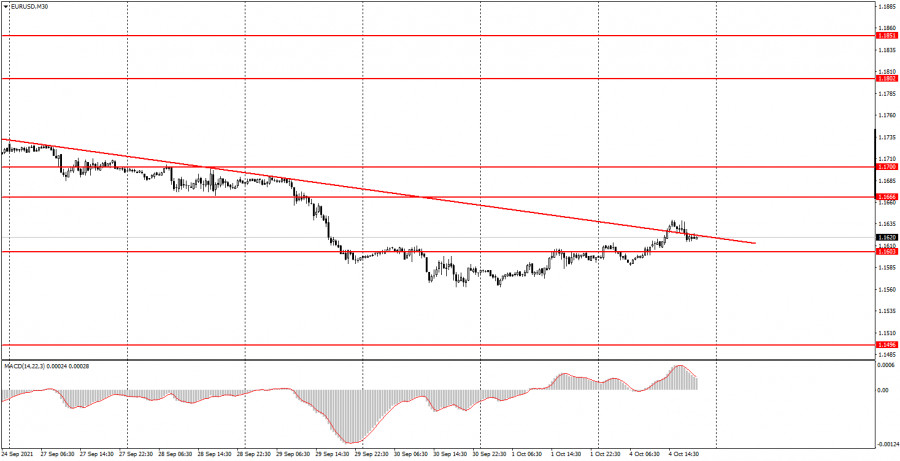
EUR/USD, 30M

This image is no longer relevant

On Monday, the euro/dollar pair was not very active, but its dynamic was not as sluggish as usual. In one day, it changed by 50 points, thus allowing beginning traders to open positions and make a profit. During the day, the pair broke the downward trend line. That is why the downward movement stopped.

Now, the pair may continue rising. The MACD indicator did not provide any sell signal. What is more, the macroeconomic calendar was almost empty. Notably, the increase is really weak and is considered a correctional movement. During the last three trading days, the pair grew just by 60 pips. Thus, newbies should understand that the pair's dynamic is sluggish.

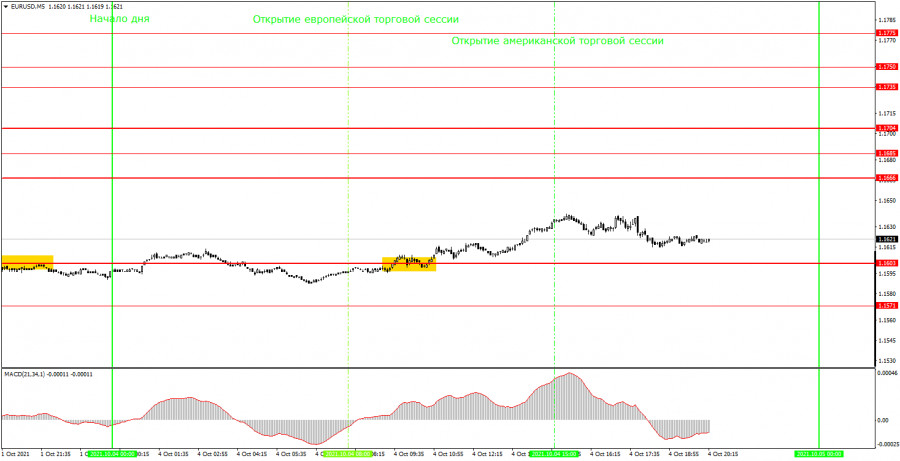
EUR/USD, 5M

This image is no longer relevant

On the 5-minute chart, the technical picture was glooming. Only one sell signal was formed during the day. However, it was quite successful. After the signal formation, the pair climbed by 30 pips, which was enough for the execution of the take profit order placed 30 pips higher from the entering point. The signal was formed when the price went above the level of 1.1603. The price was rising almost all day, but the potential was very weak.

How to trade on Tuesday:

On the 30-minute chart, the euro/dollar pair broke the downward trend line. It means that it may resume gaining in value. Since the dynamic is weak, we do not recommend taking into account the signals from the MACD indicator. On the five-minute chart, the key levels are located at 1.1571, 1.1603, 1.1666, and 1.1685. A take profit order should be placed 30-40 pips higher from the entering point. On the five-minute chart, the target could be located at the nearest level. On Tuesday, the eurozone will report on its services PMI. The US will also publish the ISM services PMI data. The market is likely to show a reaction to the second report, but it will hardly be strong.

Let us focus on the trading charts:

Support and resistance levels are targets that we indicate when opening sell or buy positions. It is possible to place a take profit order near them.

Red lines are channels or trend lines that reflect the current trend and provide sell or buy signals.

MACD indicator is a signal line. When a price crosses the line, we receive a signal to enter the market. It is recommended to use it together with trend formations (channels, trend lines).

Speeches of politicians and reports (reflected in the trader's calendar) may significantly affect the market. That is why it is recommended to be cautious at the moment of publication. Sometimes, it is better to leave the market to avoid a sharp price reversal.

Beginning traders should remember that not every trade brings profit. A clear strategy and money management is the key to long-term success.

Paolo Greco,
الخبير التحليلي لدى شركة إنستافوركس
© 2007-2024
كسب عائد من تغيرات أسعار العملات المشفرة مع إنستافوركس.
قم بتحميل منصة التداول ميتاتريدر 4 وافتح أول صفقة.
  • Grand Choice
    Contest by
    InstaForex
    InstaForex always strives to help you
    fulfill your biggest dreams.
    انضم إلى المسابقة
  • إيداع الحظ
    قم بإيداع 3,000 دولار في حسابك واحصل على $8,000 وأكثر من ذالك!
    في مايو نحن نقدم باليانصيب $8,000 ضمن حملة إيداع الحظ!
    احصل على فرصة للفوز من خلال إيداع 3,000 دولار في حساب تداول. بعد أن استوفيت هذا الشرط، تصبح مشاركًا في الحملة.
    انضم إلى المسابقة
  • تداول بحكمة، اربح جهازا
    قم بتعبئة حسابك بمبلغ لا يقل عن 500 دولار ، واشترك في المسابقة ، واحصل على فرصة للفوز بأجهزة الجوال.
    انضم إلى المسابقة
  • بونص 100٪
    فرصتك الفريدة للحصول على بونص 100٪ على إيداعك
    احصل على بونص
  • بونص 55٪
    تقدم بطلب للحصول على بونص 55٪ على كل إيداع
    احصل على بونص
  • بونص 30٪
    احصل على بونص 30٪ في كل مرة تقوم فيها بتعبئة حسابك
    احصل على بونص

المقالات الموصى بها

لا تستطيع التحدث الآن؟
اطرح سؤالك في الدردشة.
Widget callback