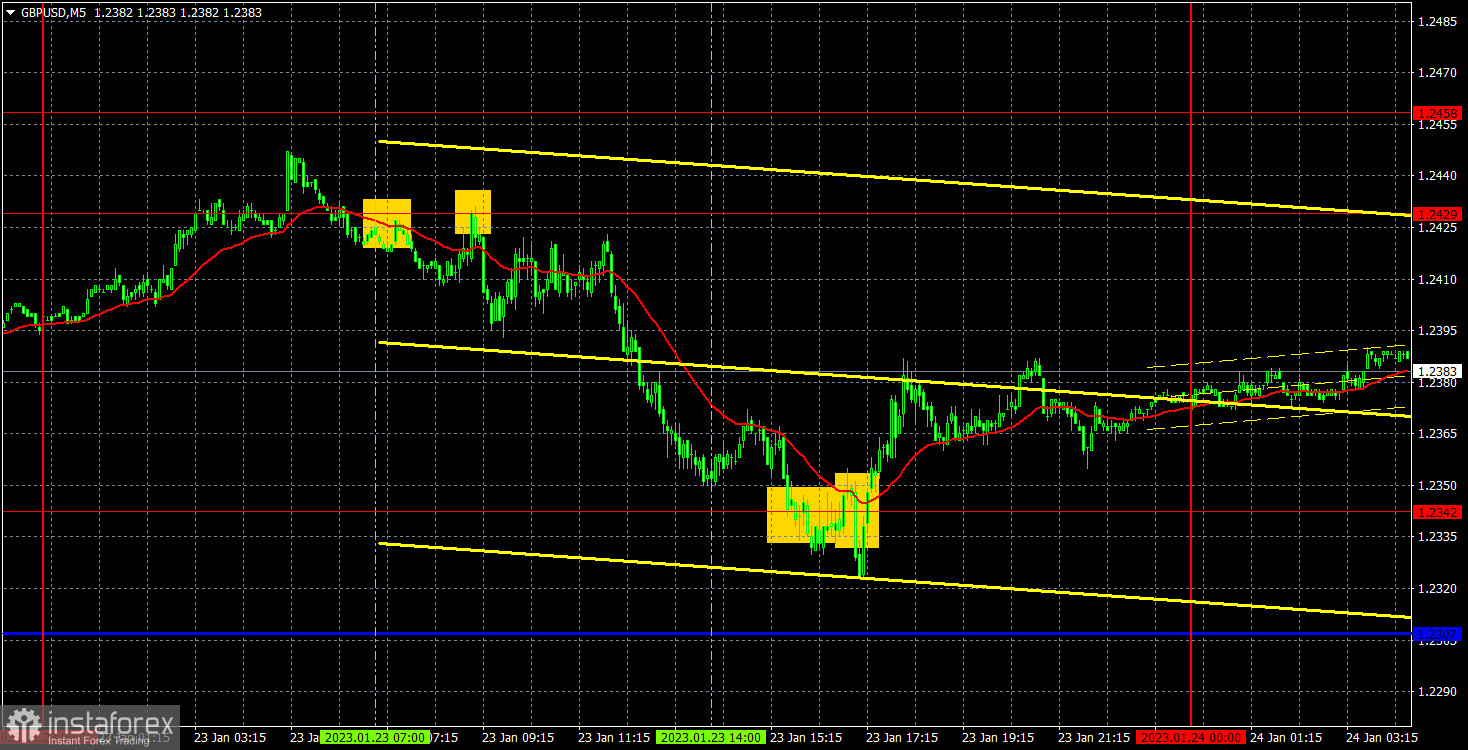
M5 chart of GBP/USD
GBP/USD corrected a bit on Monday, but it was more of a usual downward pullback than a correction, which is clearly visible on the one-hour chart. The pair failed to cross 1.2429 for the second time, but it doesn't make much sense because the pair cannot go for a new round of bearish correction either. The price is still above the Ichimoku indicator, and there is nothing to analyze on Monday because there were no interesting events in the US and the UK. Basically, the market continues to be guided by only one factor - the divergence between the rates of the Bank of England and the Federal Reserve. The market expects the Fed rate to slow down and the BoE rate to continue to rise at the same rate. We doubt that the British central bank is capable of raising the rate even higher, but the market believes in that outcome for now, so it continues to buy the pound in general, rather than the other way around.
We got some interesting signals since the pair's quotes were moving in the same direction for most of the day. At the beginning of the European session, the price rebounded from 1.2429 twice, after which it went down to 1.2342. These signals should have been covered by a short position, and the position could have been closed when the price settled above 1.2342. The profit on this deal was about 60 pips. You could have also used the buy signal near 1.2342, and it proved to be profitable. The deal should have been closed manually closer to the evening, the profit was about 20 points.
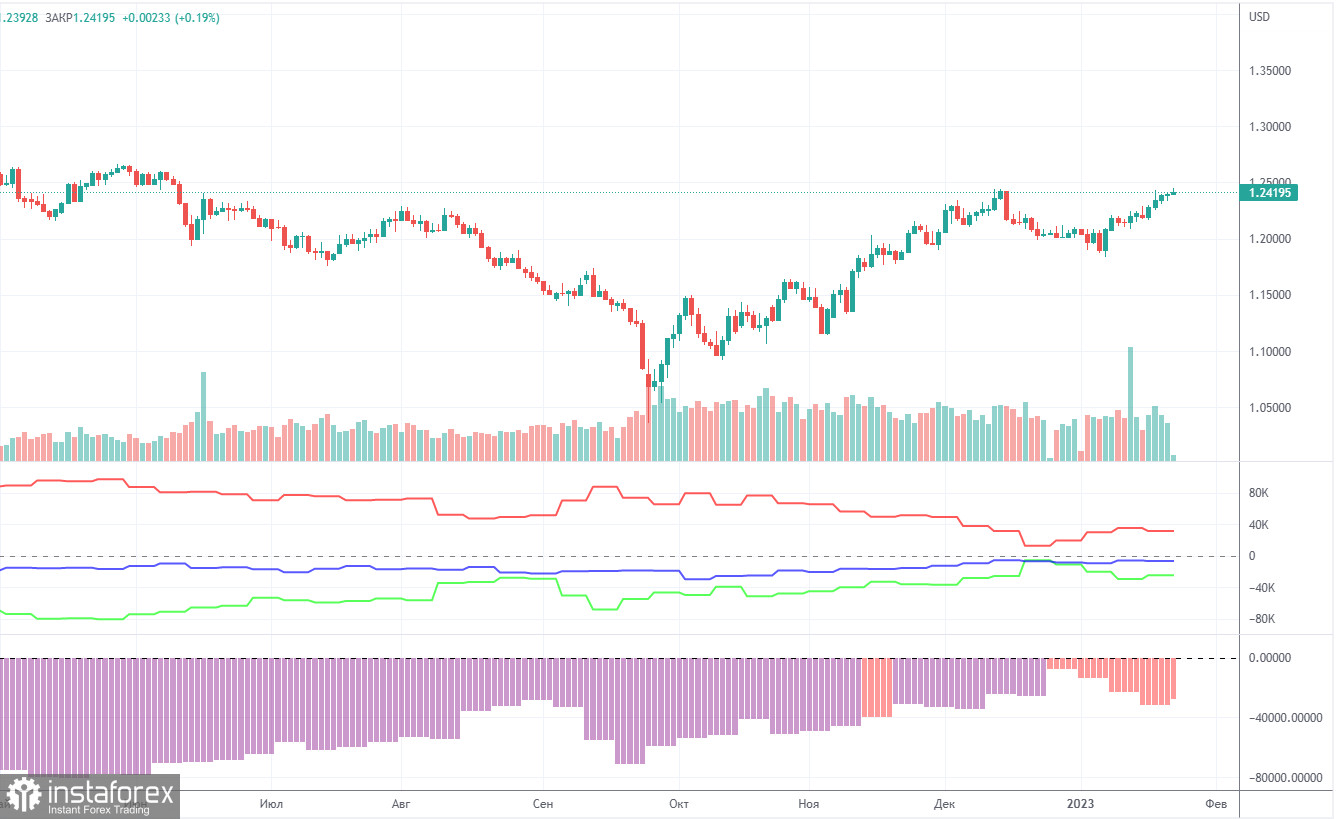
COT report
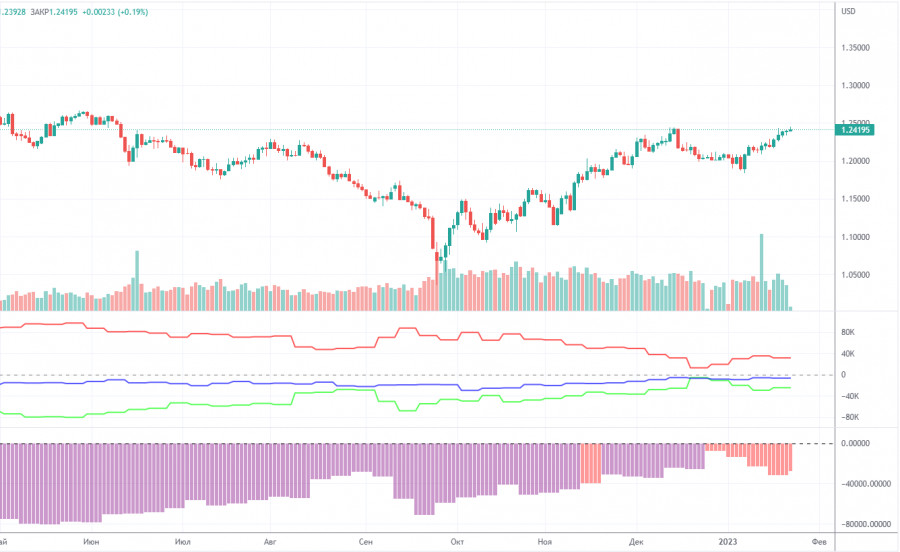
The latest COT report showed a decrease in bearish sentiment. During the given period, non-commercial traders opened 5,500 long positions and as many as 700 short positions. Thus, the net position increased by 4,800. This figure has been on the rise for several months, and the sentiment may become bullish in the near future, but it hasn't yet. Although the pound has grown against the dollar for the last few months, from a fundamental perspective, it is difficult to answer why it keeps rising. On the other hand, it could fall in the near future (in the mid-term prospect) because it still needs a correction. In general, in recent months the COT reports correspond to the pound's movements so there shouldn't be any questions. Since the net position is not even bullish yet, traders may continue to buy the pair over the next few months. Non-commercial traders now hold 41,500 long positions and 66,000 short ones. I remain skeptical about the pound's long term growth, though there are technical reasons for it. At the same time, fundamental and geopolitical factors signal that the currency is unlikely to strengthen significantly.
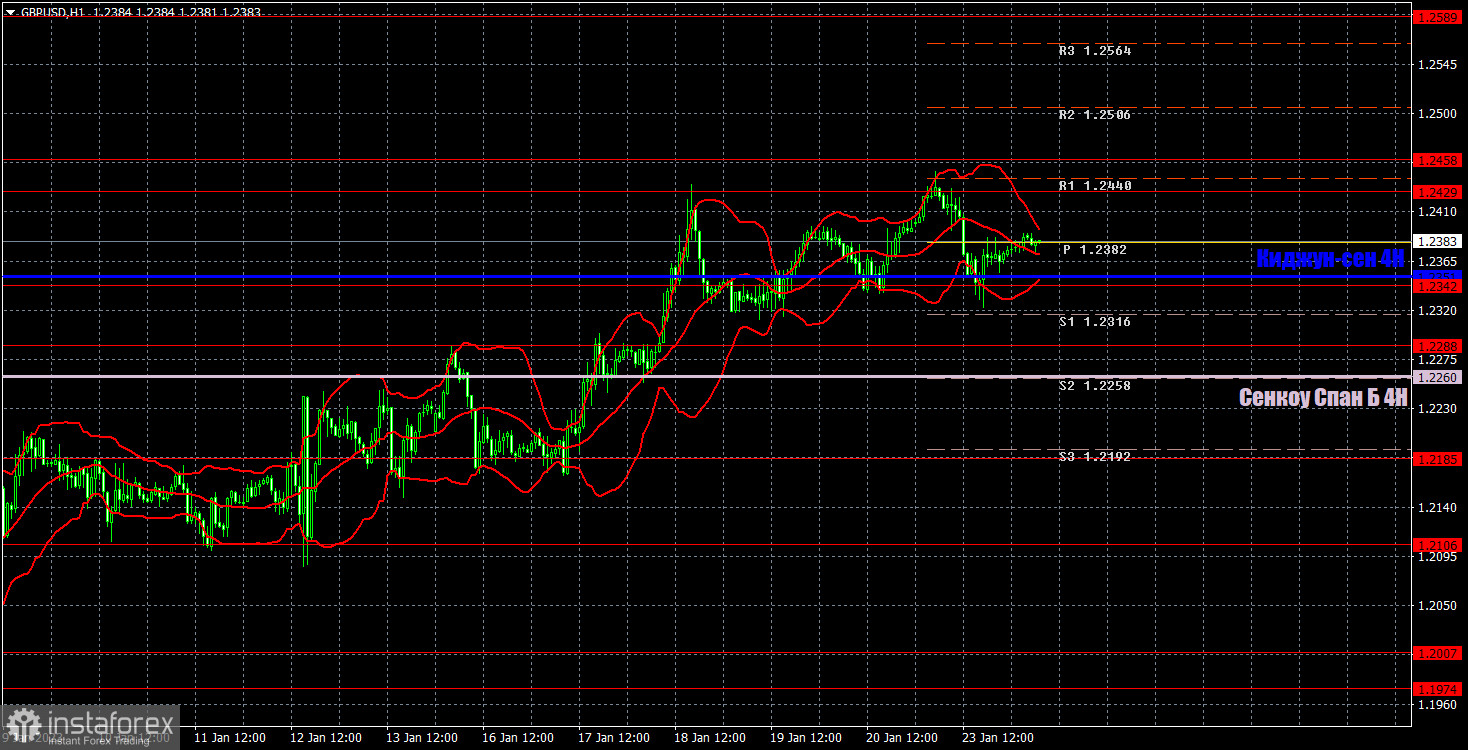
H1 chart of GBP/USD
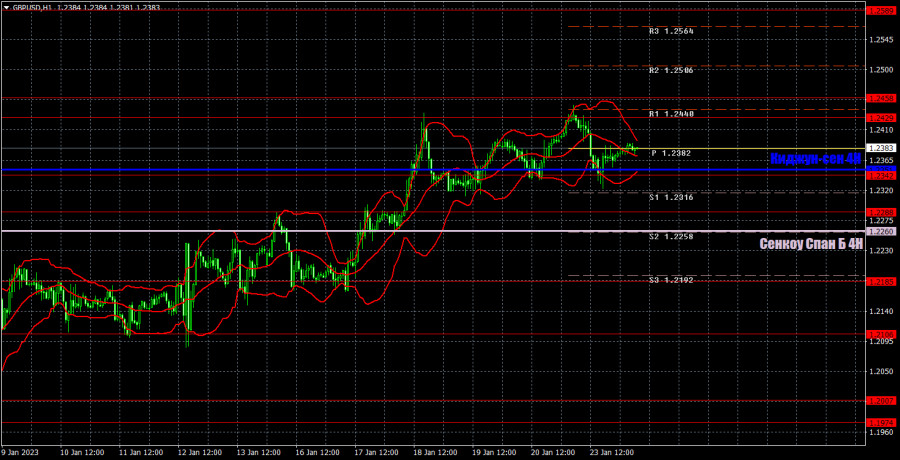
On the one-hour chart, GBP/USD is still trading in an uptrend and continues to settle above the lines of the Ichimoku indicator. Thus, the market may continue to buy the pound this week, when the fundamental and macroeconomic background will be quite scarce. But market participants have repeatedly shown that they are willing to buy the pair for no particular reason. On January 24, the pair may trade at the following levels: 1.2106, 1.2185, 1.2288, 1.2342, 1.2429-1.2458, 1.2589, 1.2659. The Senkou Span B (1.2260) and Kijun Sen (1.2351) lines may also generate signals. Pullbacks and breakouts through these lines may produce signals as well. A Stop Loss order should be set at the breakeven point after the price passes 20 pips in the right direction. Ichimoku indicator lines may move during the day, which should be taken into account when determining trading signals. In addition, the chart does illustrate support and resistance levels, which could be used to lock in profits. On Tuesday, manufacturing and services sector business activity indexes will be released in the US and the UK, but it is not the most important data. We are not interested in the market reaction of 20-30 points. We already see such a movement every day even without important reports. We can only count on a stronger reaction if the values of the reports are surprising.
What we see on the trading charts:
Price levels of support and resistance are thick red lines, near which the movement may end. They do not provide trading signals.
The Kijun-sen and Senkou Span B lines are the lines of the Ichimoku indicator, moved to the one-hour chart from the 4-hour one. They are strong lines.
Extreme levels are thin red lines from which the price bounced earlier. They provide trading signals.
Yellow lines are trend lines, trend channels, and any other technical patterns.
Indicator 1 on the COT charts reflects the net position size of each category of traders.
Indicator 2 on the COT charts reflects the net position size for the non-commercial group.