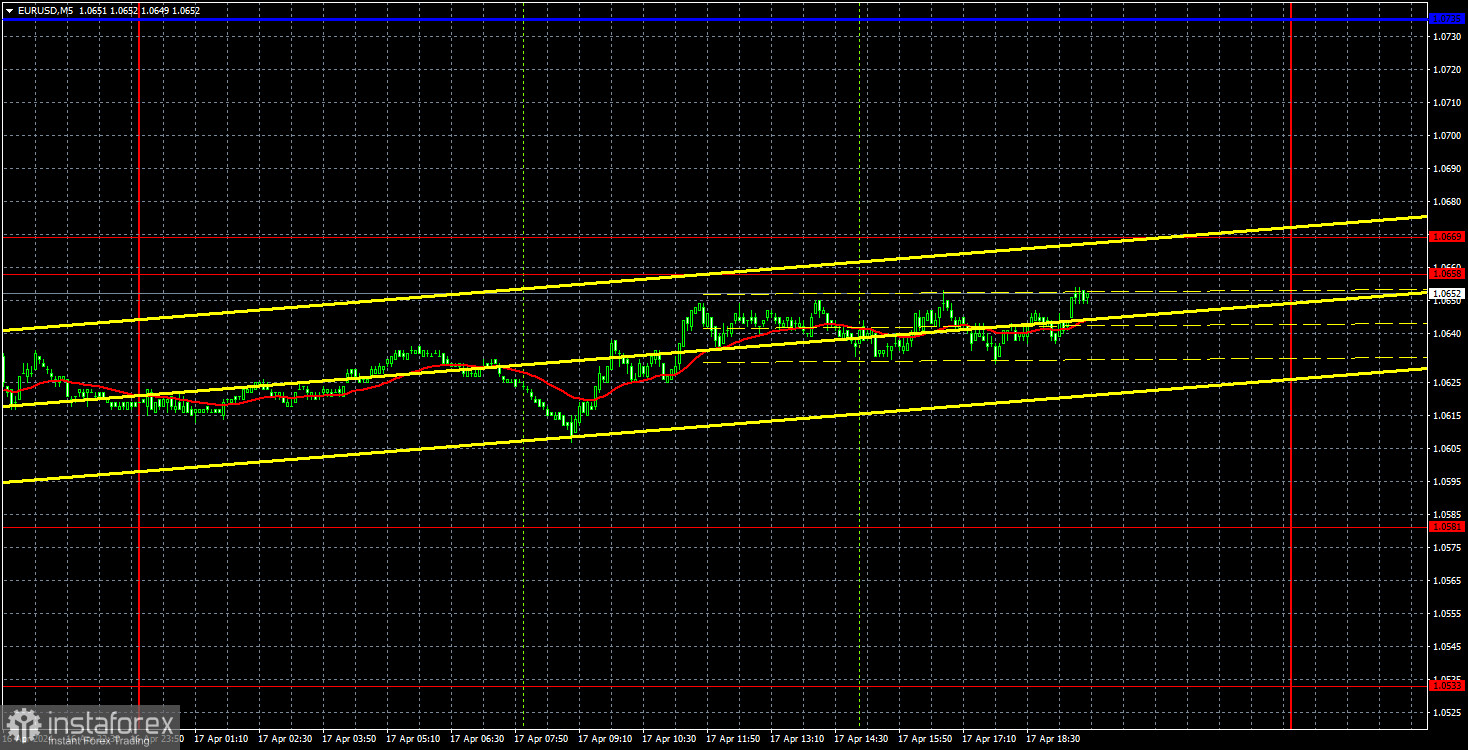
Analysis of EUR/USD 5M
EUR/USD traded mostly sideways with low volatility on Wednesday. The low market activity can be attributed to the weak fundamental and macroeconomic background. There were no significant events during the day. Federal Reserve Chairman Jerome Powell gave a speech on Tuesday evening, and he said there's been a "lack of further progress" on tackling the record-high inflation rates in the US. In our opinion, this means that the central bank will not lower rates in June, as we have repeatedly warned you.
Powell's speech itself did not trigger any market reaction, and the dollar did not rise as it should have. Nevertheless, the fundamental background works in the dollar's favor. Therefore, we expect EUR/USD to fall further. This week, we see that the bears have decided to take a break after the sharp decline the previous weeks, but bulls lack the strength to start a minor correction. We believe that this is logical, considering the latest US macro data and the fact that the Fed is almost guaranteed not to lower the rate in June.
No trading signals were formed on Wednesday. The price remains below the 1.0658-1.0669 area, and each rebound from it is a sell signal with good profit potential. However, the price barely reached this area by the evening. You may consider short positions if there is a rebound from it overnight or in the morning. But there were no trading signals.
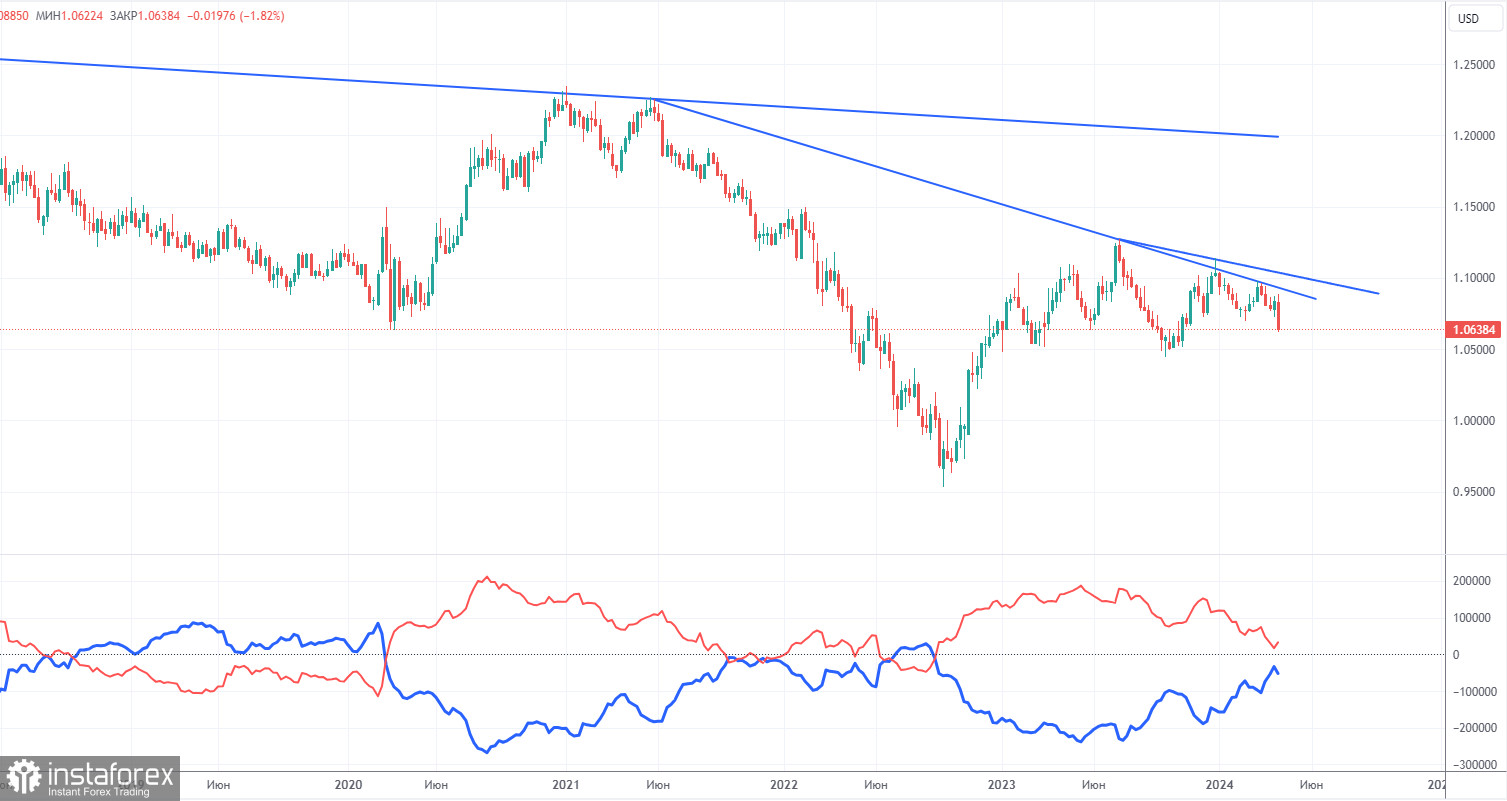
COT report:
The latest COT report is dated April 9th. The net position of non-commercial traders has been bullish for quite some time. Basically, the number of long positions in the market is higher than the number of short positions. However, at the same time, the net position of non-commercial traders (red line) has been decreasing in recent months, while that of commercial traders (blue line) has been increasing. This shows that market sentiment is turning bearish, as speculators continue to sell the euro. Furthermore, we don't see any fundamental factors that can support the euro's strength, while technical analysis also suggests a downtrend. Three descending trend lines on the weekly chart indicate that there's a good chance of continuing the decline.
At present, the red and blue lines are moving towards each other (indicating a trend reversal after a rise). Therefore, we believe that the euro will fall further. During the last reporting week, the number of long positions for the non-commercial group decreased by 12,800, while the number of short positions decreased by 28,700. Accordingly, the net position increased by 15,900. Overall, both the euro and the net position continue to decline. The number of buy contracts is higher than the number of sell contracts among non-commercial traders by only 32,700 (previously 31,000).
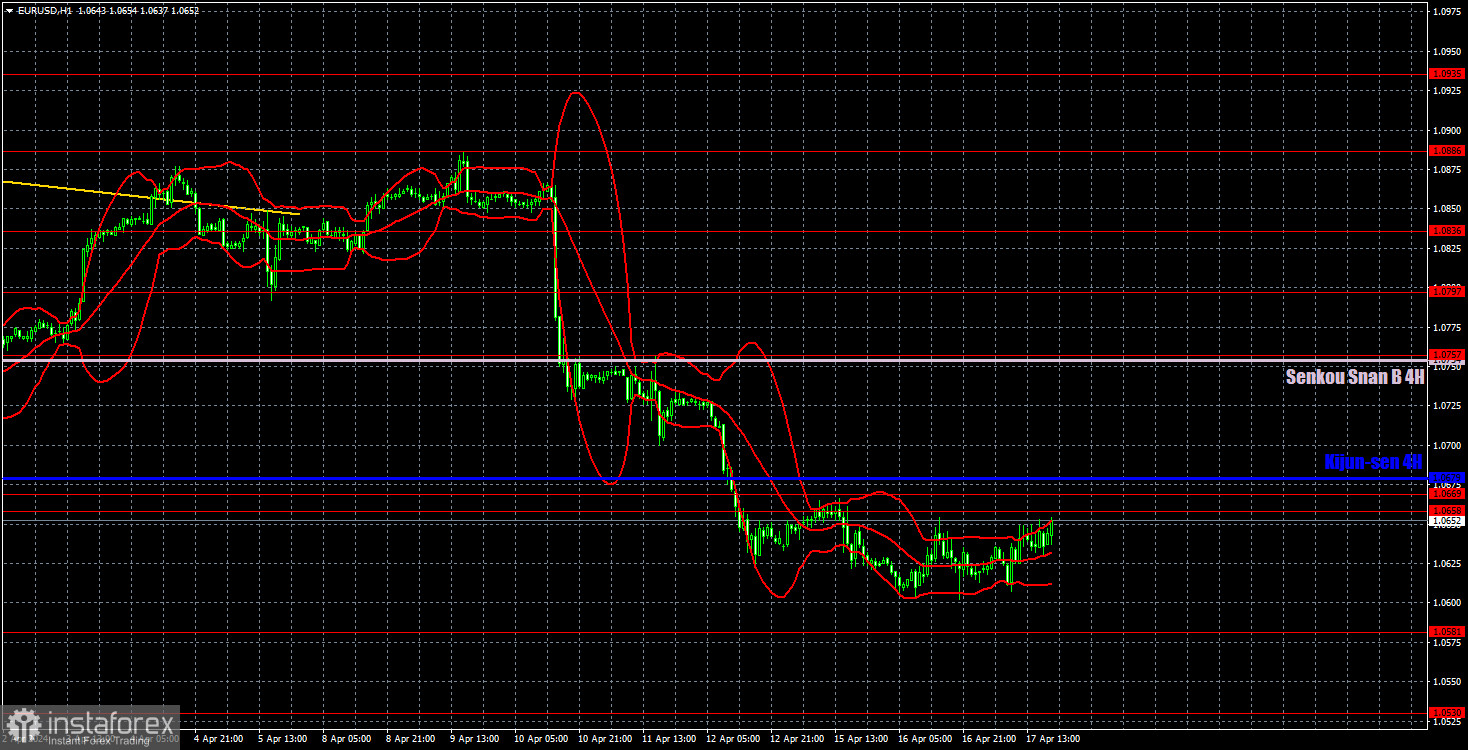
Analysis of EUR/USD 1H
On the 1-hour chart, EUR/USD resumed its downward trend but has remained in a flat phase for several consecutive days. Since expectations for a Fed rate cut in 2024 have significantly grown smaller, the US dollar can and should continue to rise for a couple more months at least. Especially in light of the upcoming ECB rate cut in June. Practically all the factors suggest downward movement for the pair. The market needs to take a break for some time, but we do not expect upward movements to be stronger than the correction.
On April 18, we highlight the following levels for trading: 1.0530, 1.0581, 1.0658-1.0669, 1.0757, 1.0797, 1.0836, 1.0886, 1.0935, 1.1006, 1.1092, as well as the Senkou Span B (1.0754) and Kijun-sen (1.0679) lines. The Ichimoku indicator lines can move during the day, so this should be taken into account when identifying trading signals. Don't forget to set a Stop Loss to breakeven if the price has moved in the intended direction by 15 pips. This will protect you against potential losses if the signal turns out to be false.
On Thursday, there are no significant events scheduled in the European Union, and the US will only publish a few minor reports. These are the number of initial jobless claims and the number of new home sales. Both reports have extremely low chances of triggering a market reaction of more than 20 pips. It seems we are in for another, fourth consecutive "boring day."
Description of the chart:
Support and resistance levels are thick red lines near which the trend may end. They do not provide trading signals;
The Kijun-sen and Senkou Span B lines are the lines of the Ichimoku indicator, plotted to the 1H timeframe from the 4H one. They provide trading signals;
Extreme levels are thin red lines from which the price bounced earlier. They provide trading signals;
Yellow lines are trend lines, trend channels, and any other technical patterns;
Indicator 1 on the COT charts is the net position size for each category of traders;