GBP/USD 5M
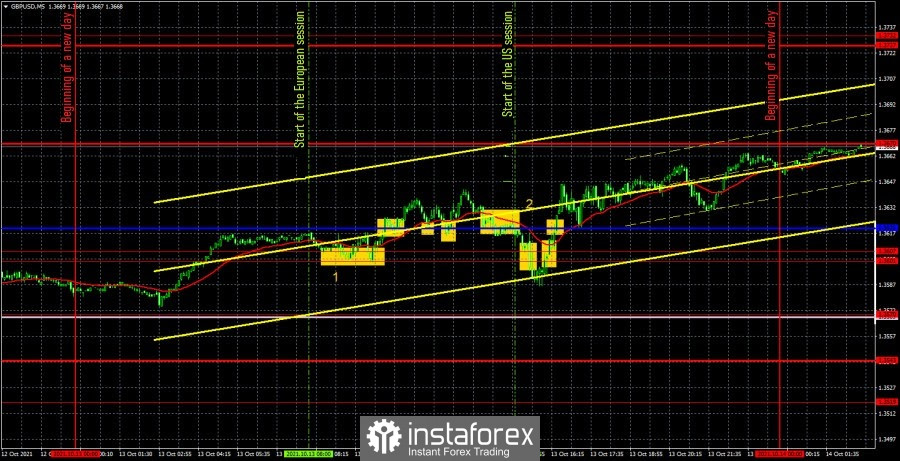
The GBP/USD pair did not trade very well on October 13. The price crossed the critical Kijun-sen line many times during the day, forming false signals, which, in principle, is not surprising, given the nature of the pair's movement, which we have been talking about all last week. Macroeconomic statistics, which were published yesterday, did not help the technical picture at all, but, on the contrary, only confused everything more. The reports themselves were also controversial. For example, the UK GDP report for August turned out to be worse than forecasted, while industrial production was better. But at the same time, the GDP report itself for one month is not considered important. The report for the quarter is considered important. Thus, it is clearly seen in the chart above that there was no reaction to these reports (figure "1"). The number "2" in the chart marks the time when the US inflation report was published and, as we can see, after this report came out the quotes fell by 25 points, although this process ended very quickly and an upward movement began (the dollar's fall). That is, the same thing that was observed for the euro/dollar pair. Therefore, the most important thing yesterday was to filter out all false signals. It should be noted right away that the Bollinger bands on the 4-hour timeframe are directed sideways and at the same time narrowed very much. Therefore, in our previous reviews, we said that the Ichimoku indicator lines are now not suitable for generating signals. Therefore, we miss all signals near the critical line. Only the signals that were formed around the levels 1.3601 and 1.3607 remain. The first of them was not strong or accurate, and the Kijun-sen also lay slightly above these levels, so the buy signal should not have been worked out. The same is with the signal to buy in the US session, when the price crossed the 1.3601 and 1.3607 levels from bottom to top, and then the critical line. And all this after a fairly strong inflation report in the US, after which the dollar should have grown. The last signal - a signal to sell - was formed exactly at the time when the US inflation report was released, therefore, it should also be filtered out. As a result, traders should not have opened any deals yesterday.
GBP/USD 1H
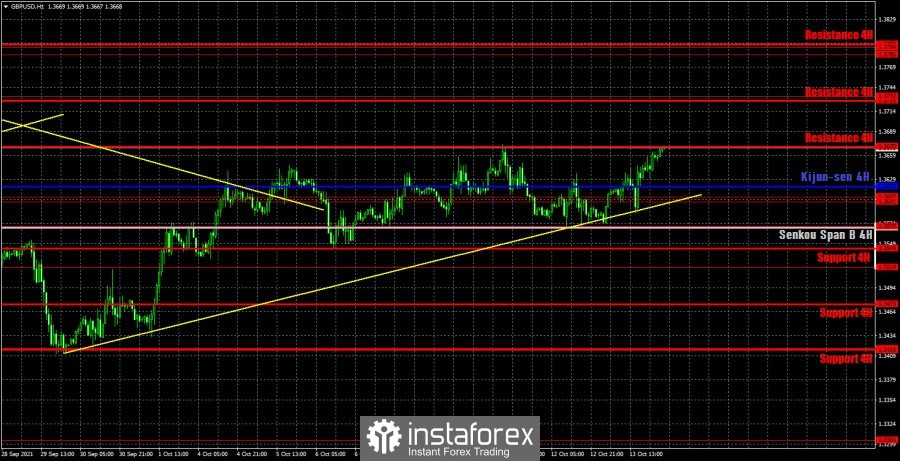
The pound/dollar pair is trying to maintain an upward trend on the hourly timeframe, and so far it has been successful! The price bounced off the upward trend line yesterday, and this signal can indeed be considered the most important event of the day. Of course, it didn't work to make money on it either, since the candlestick on which the rebound occurred was the largest one in a day, equal to almost the entire daily volatility. Nevertheless, traders can still count on the pound's succeeding growth. At the 4-hour TF, the Bollinger bands indicate a flat. In a flat, the lines of the Ichimoku indicator lose their strength, and the price can overcome them without any special difficulties. Therefore, it is not recommended to use the Ichimoku line in a flat as a source of signal. We distinguish the following important levels on October 14: 1.3519, 1.3570, 1.3601 - 1.3607, 1.3732. Senkou Span B (1.3569) and Kijun-sen (1.3620) lines can also be sources of signals (but there is a high probability that they are false now). It is recommended to set the Stop Loss level at breakeven when the price passes 20 points in the right direction. The Ichimoku indicator lines can move during the day, which should be taken into account when looking for trading signals. The news calendar is empty in the UK on Thursday, and in the United States there will be only a couple of secondary events that are unlikely to have a strong impact on the pound/dollar quotes.
We also recommend that you familiarize yourself with the forecast and trading signals for the EUR/USD pair.
COT report
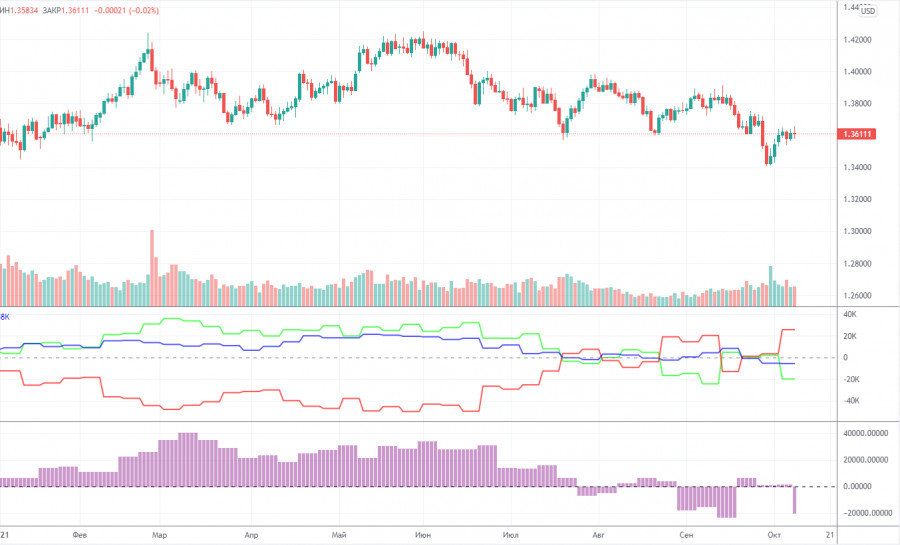
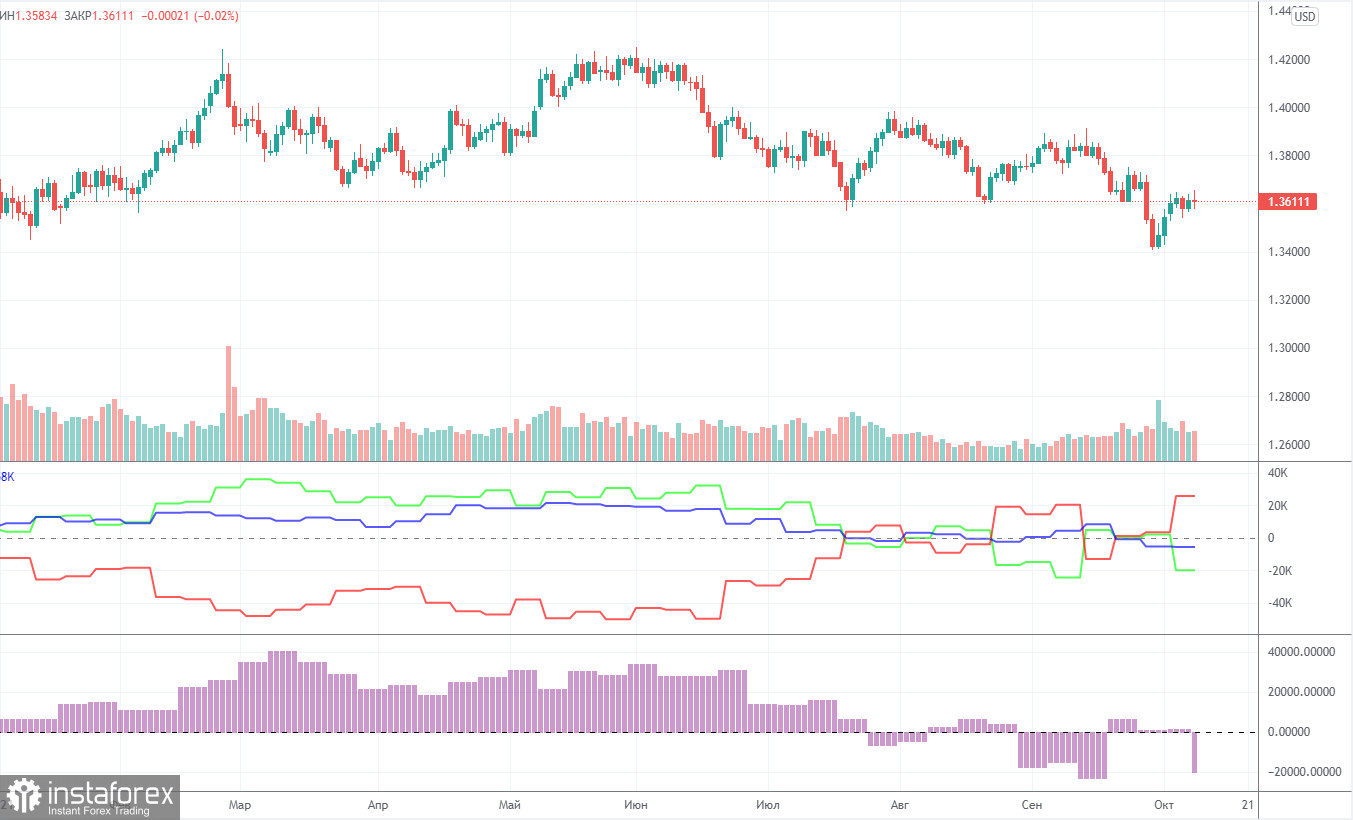
The mood of professional traders became much more bearish again during the last reporting week (September 28 - October 4). "Again" - not because it has been constantly increasing in recent weeks, but because traders could not decide what to do with the British pound. Therefore, their moods became bullish, then returned to being bearish. The last change was again in the direction of bears. Professional traders opened 12,000 sell contracts (shorts) and closed 10,000 buy contracts (longs) in a week. Thus, the net position of the "non-commercial" group decreased by 22,000 contracts at once. In the chart above, you can clearly see how the green line of the first indicator fell. We see the same effect with the second indicator, which displays changes in the net position only of non-commercial traders who are considered the most important and trend-forming group. Thus, the bearish mood now prevails, as in the case of the European currency. Technique is also talking about a very likely resumption of downward movement. However, looking at price changes over the past year and comparing them with Commitment of Traders (COT) reports, it becomes clear that not everything is so simple. Simply because the pound is still very weakly corrected against the global upward trend. For example, the peak value of the "non-commercial" net position over the last year was approximately 40,000. At the moment we have a peak minimum value of - 20,000. And the price is still in the same weak downward correction globally.
Explanations for the chart:
Support and Resistance Levels are the levels that serve as targets when buying or selling the pair. You can place Take Profit near these levels.
Kijun-sen and Senkou Span B lines are lines of the Ichimoku indicator transferred to the hourly timeframe from the 4-hour one.
Support and resistance areas are areas from which the price has repeatedly rebounded off.
Yellow lines are trend lines, trend channels and any other technical patterns.
Indicator 1 on the COT charts is the size of the net position of each category of traders.
Indicator 2 on the COT charts is the size of the net position for the non-commercial group.